
Guides
Escape room and FEC add-on attractions payback model
Escape room and FEC add-on attractions payback depends on your quote, rent allocation and labor; use this model and axe-throwing example to test the math.
What to take away
Escape room and FEC add-on attractions payback is a modeling exercise: use your quote, allocate rent to the add-on's space, and include payroll and operating costs before dividing investment by contribution.
- Use revenue per operating hour and fill rate by daypart to forecast sales for each operating period.
- Estimate labor from staffing minutes per session and your payroll cost; include consumables and payment fees.
- Subtract operating costs and allocated rent from projected sales over the same period to find contribution.
- Divide total installed investment by positive contribution for that period to estimate simple payback.
- Use capital cost per square foot to compare space efficiency, not as a substitute for the full investment in the payback calculation.
The four numbers that decide add-on payback
Vendor quotes usually cover equipment, installation and a capacity chart. They rarely cover the numbers that decide whether the money returns.
Pull four operating and comparison inputs from your records: revenue per operating hour, fill rate by daypart, staffing minutes per session, and capital cost per square foot. Calculate the last as total installed investment divided by the add-on's area; use the full installed investment in the payback calculation. Also collect the rent allocation and payroll cost for scheduled labor.
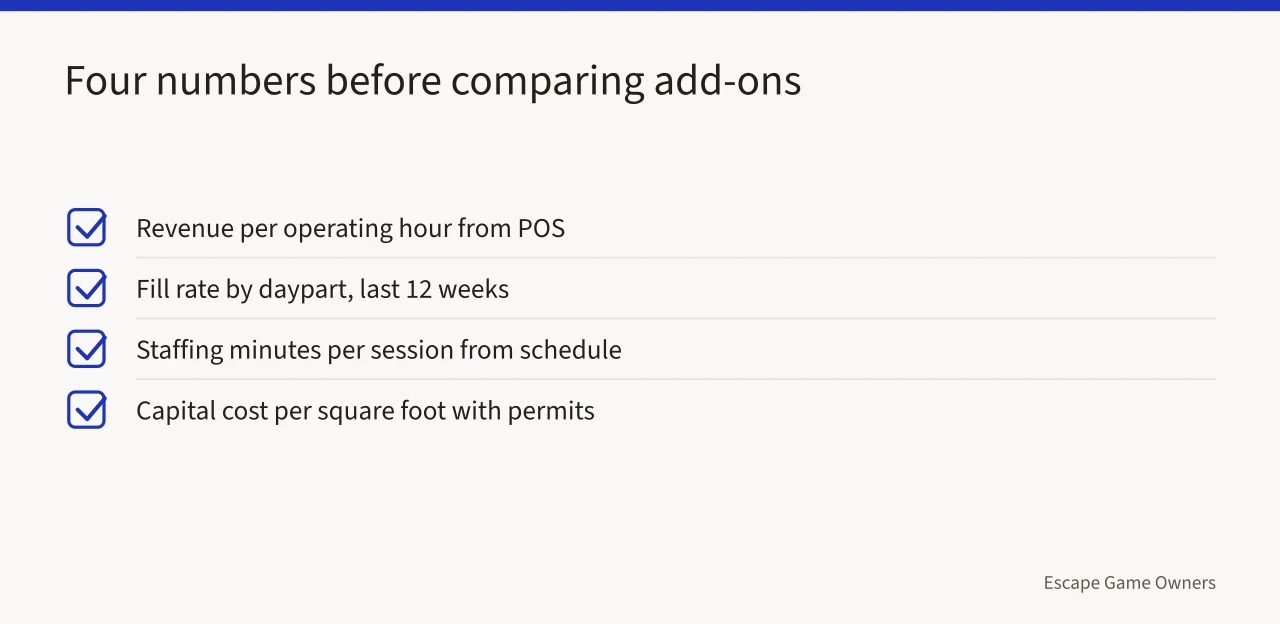
Use those operating inputs to assess a throwing lane, a VR arena, or a nine-hole course with each site's own quote, rent allocation and wage rate. Fill in those inputs before deciding whether the economics work.
An add-on that fills Tuesday nights at low staff cost beats a bigger attraction that only sells on Saturdays.
Example: payback math for a four lane axe throwing bay
For an illustrative calculation, use these assumptions: a $60,000 contractor quote for a four-lane bay built inside existing shell space, a $30 ticket, eight throwers per 90-minute slot, and 12 slots sold each week.
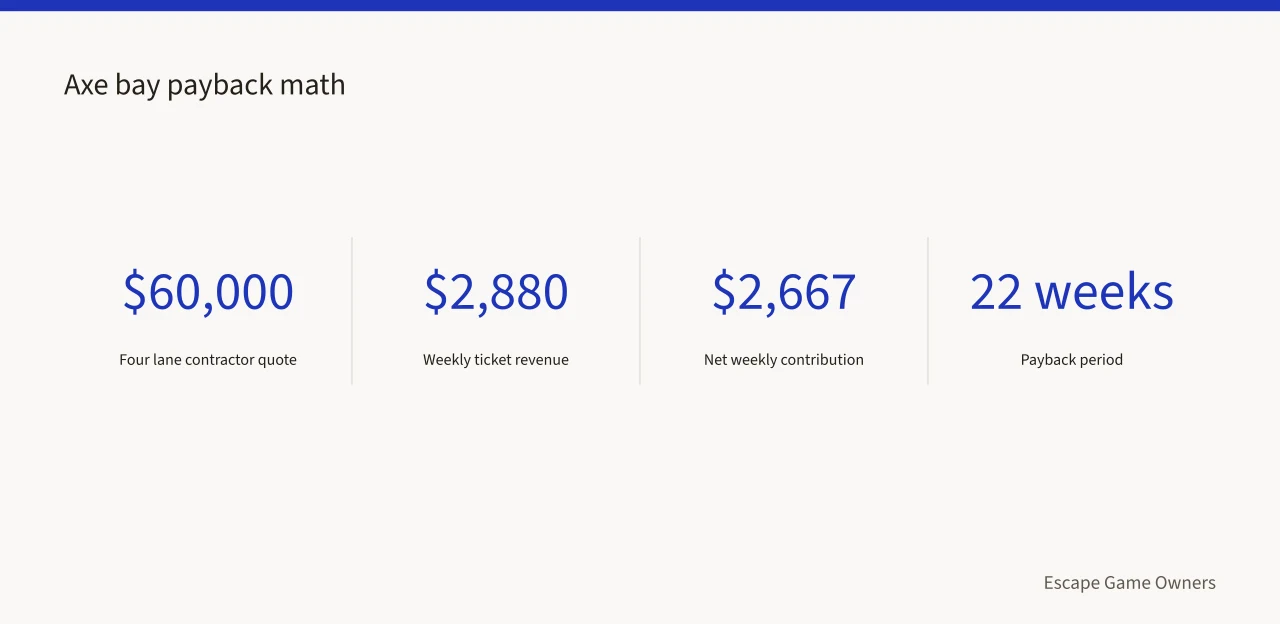
Weekly ticket revenue is $2,880. On the stated assumptions, subtract $108 for coach wages, $30 for consumables, and $75 for card fees at 2.6 percent, leaving $2,667. The coach line is an illustrative cost assumption, not a recommended wage; replace it with the payroll cost for all paid hours in your schedule.
That returns the $60,000 in about 22 weeks, or five months, before rent allocation. Change one assumption and the answer moves. If you allocate rent by space, multiply total rent by the add-on's share of rentable area, then convert it to the same weekly period as contribution. Subtract that allocated rent from $2,667 and divide $60,000 by the remaining weekly contribution. If the remaining contribution is zero or negative, this scenario has no finite payback.
Run the same formula for a VR arena or a nine-hole mini golf course, replacing the example assumptions with each venue's quote, schedule, capacity, rent allocation and payroll cost. Without those site-specific inputs, the calculation does not produce a defensible payback figure. For how the same numbers sort the four options, see which add-ons pay back in a US market.
Capacity and staffing checks for add-ons
How four add-ons compare
Revenue unit
- Axe throwing bay
- Thrower per 60 to 90 minute slot
- VR arena
- Station per 15 to 30 minute session
- Indoor mini golf
- Player per round
- Escape room (reference)
- Player per 60 minute game
Capacity limit
- Axe throwing bay
- Lanes multiplied by available coaches
- VR arena
- Stations multiplied by sessions per hour
- Indoor mini golf
- Holes multiplied by hourly throughput
- Escape room (reference)
- Rooms multiplied by games per day
Staffing pattern
- Axe throwing bay
- One coach per one to two lanes
- VR arena
- One attendant per four to six stations
- Indoor mini golf
- One attendant per course, fixed
- Escape room (reference)
- One game master per one to two rooms
Main payback risk
- Axe throwing bay
- Weekday demand and no-shows
- VR arena
- Headset downtime and cleaning turns
- Indoor mini golf
- Rent per player and floor area
- Escape room (reference)
- Repeat play is low
Only one column is about equipment. Capacity limits and staffing patterns decide how many sellable hours a bay or course actually has.
Score options on those two columns first, then run the payback arithmetic on the shortlist.
Where add-ons change staffing and egress limits
Every add-on changes occupant load, and occupant load drives egress requirements. NFPA 101 applies a business occupancy load factor of 100 gross square feet per person.
OSHA 1910.36 sets the exit route rules US operators apply to a mixed floor plan, covering the number of exits and their capacity.
A party room, a second bay or a queue area can push a unit past the point where one exit is allowed.
Recheck egress load before signing a lease for extra square footage, not after the build is finished.
Compliance costs that add-ons inherit
Axe throwing, VR and mini golf all fall under public accommodation rules. The 2010 ADA Standards for Accessible Design govern route width, turning space and door clear width.
Those rules constrain lane placement, station layout and hole spacing. Retrofitting after installation costs more than planning the layout around them.
Accessibility review belongs in the capital budget line, not in the contingency.
Bundling that lifts ancillary revenue per visit
Add-on revenue behaves differently when it is sold at booking. A guest who books an escape room and a throwing slot in one transaction arrives with both on the calendar.
A single deposit and one checkout lift average transaction value without a second marketing spend.
Deposits and card-not-present payments bring security duties. The PCI Security Standards Council publishes the requirements your booking software has to meet.
Match your checkout to those requirements before you add a second revenue stream to the same page.